Mastering Google Lighthouse Metrics: The Ultimate Developer’s Guide to Web Performance
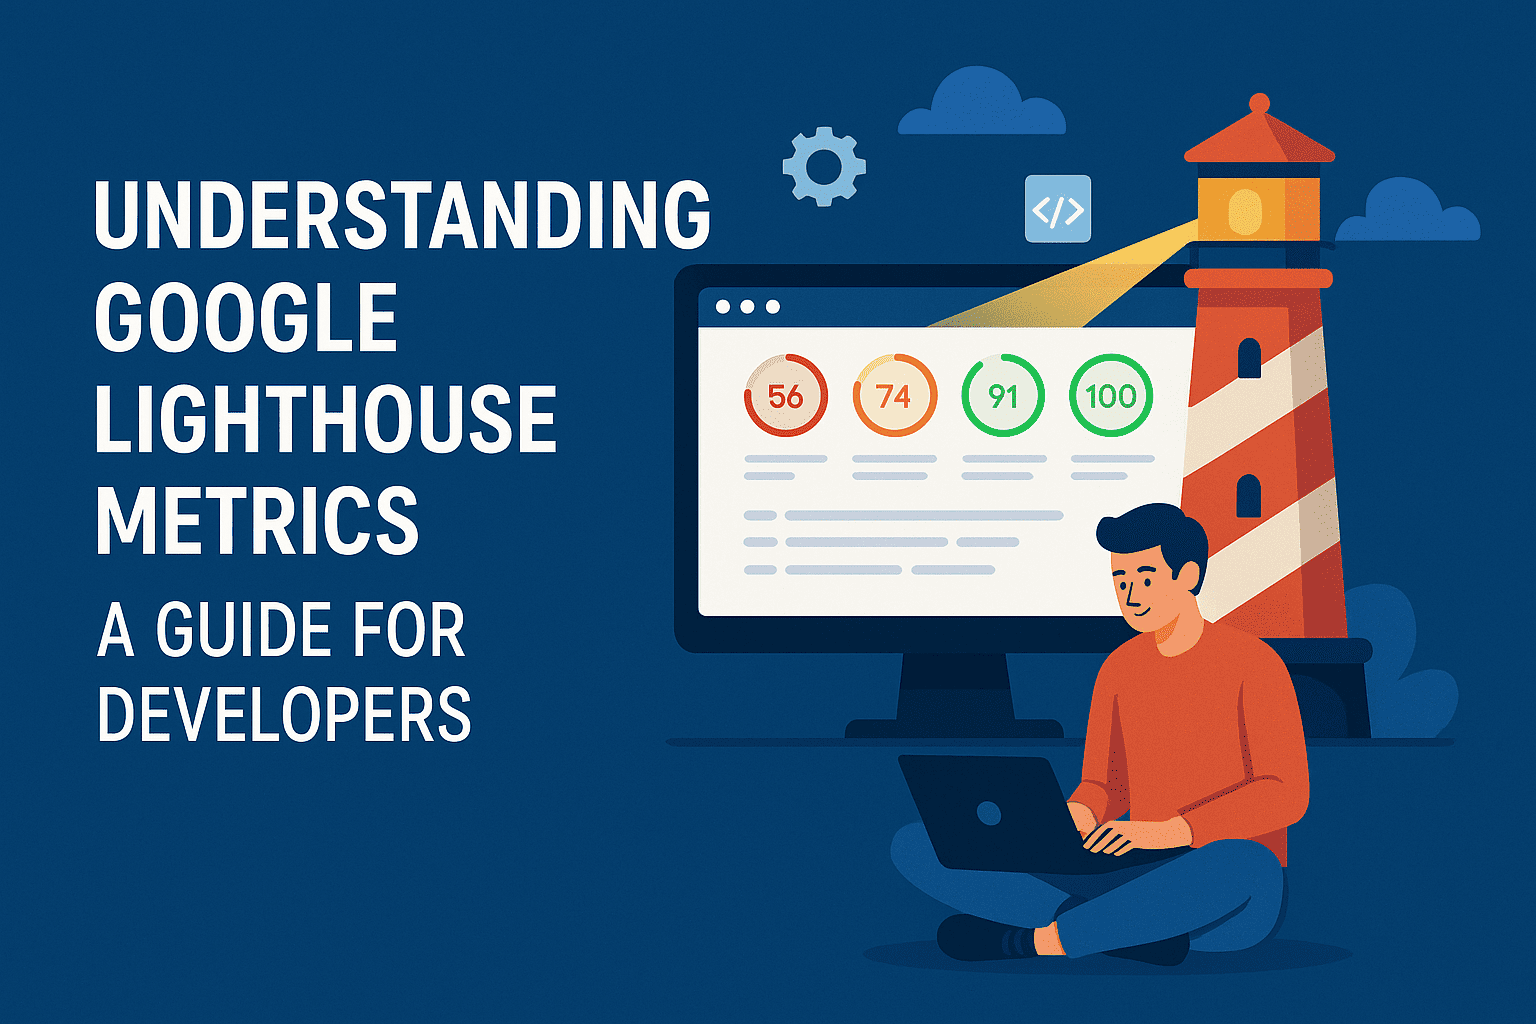
Understanding Google Lighthouse Metrics: A Guide for Developers
In today’s fast-paced digital world, website performance is more than just a nice-to-have—it’s a necessity. From user experience to SEO rankings, every millisecond counts. That’s where Google Lighthouse steps in as a powerful, open-source tool to help developers audit and optimize their websites.
In this guide, we’ll break down the Google Lighthouse metrics, explain what they mean, and show you how to use them to improve your website’s performance, accessibility, SEO, and more.
🔍 What is Google Lighthouse?
Google Lighthouse is an automated website auditing tool provided by Google. It evaluates webpages across several key areas:
Performance
Accessibility
Best Practices
SEO
Progressive Web App (PWA)
Lighthouse generates a detailed report with scores from 0 to 100 for each category, helping developers pinpoint issues and measure improvements over time.
⚡ Focus on Lighthouse Performance Metrics
Let’s explore the most important Lighthouse metrics developers should know:
1. First Contentful Paint (FCP)
Measures how long it takes for the first text/image to be painted.
A fast FCP improves perceived load speed.
2. Largest Contentful Paint (LCP)
Evaluates when the largest visible element (like a hero image or headline) loads.
Target: under 2.5 seconds.
3. Total Blocking Time (TBT)
Calculates how long a page is non-interactive due to long-running JavaScript.
The lower, the better (target: under 200ms).
4. Cumulative Layout Shift (CLS)
Measures unexpected layout shifts during page load.
Important for visual stability (target: less than 0.1).
5. Speed Index
Shows how quickly content is visually displayed.
A lower score means a better user experience.
🛠️ How to Improve Lighthouse Metrics
Here are practical ways to boost your scores:
| Metric | Optimization Tips |
|---|---|
| FCP, LCP | Optimize image sizes, use lazy loading, and preload important assets |
| TBT | Minimize JS execution time, reduce third-party scripts |
| CLS | Use fixed dimensions for images, avoid dynamic content shifts |
| Speed Index | Minimize main-thread work and use a fast hosting provider |
Bonus tip: Regularly audit your site with Lighthouse via Chrome DevTools or integrate it into your CI/CD pipeline using tools like GitHub Actions or Jenkins.
🌍 External Tools That Help
While Lighthouse is great, it works even better with other performance testing tools:
These tools often include Lighthouse under the hood, but offer additional geographic or device-level testing.
📈 Why Lighthouse Metrics Matter for SEO
Google uses performance and Core Web Vitals as ranking signals. A good Lighthouse report means your site loads quickly, behaves predictably, and is accessible to all users. This directly boosts your search rankings and conversion rates.
✅ Final Thoughts
Mastering Google Lighthouse Metrics isn’t just for frontend geeks—it’s essential for any web developer, SEO expert, or digital business owner who wants to stay competitive in 2025 and beyond.
Start by auditing your website, fixing what matters most, and continuously tracking improvements. It’s not about getting a perfect 100—it’s about providing the best user experience possible.

